Line Finding
Spectacle has automated line-finding and characterization, including support for blended features. The line finder uses a series of convolutions to indicate where the slope of the spectrum changes, and uses these positions to characterize the shape of the absorption or emission lines. Such characterization includes finding the centroid, the width of the line, and the whether or not lines are buried within the region of another.
The line finder will return a generated spectral model from the found lines.
Auto-generate spectral model
The inputs to the LineFinder class
help dictate the behavior of the finding routine and what lines the finder will
consider when it believes it has found a feature.
The user may note that the line finder takes many of the same parameters accepted when
creating a Spectral1D model explicitly. This
is because these parameter are based onto the internal initialization of the
spectral model. The accepted line finder arguments are summarized in the table
below.
Argument |
Description |
|---|---|
ions |
The subset of ion information to use when parsing potential profiles in the spectral data. |
continuum |
A |
defaults |
A dictionary describing the default arguments passed to internal |
auto_fit |
Whether the line finder should attempt to automatically fit the resulting spectral model to the provided data. |
velocity_convention |
The velocity convention used in internal conversions between wavelength/frequency and velocity space. |
output |
Describes the type of data the spectrum model will produce. This can be one of |
The ions argument allows the user to select a subset of the entire ion
table for the line finder to use when attempting to parse a particular profile.
If no ions are provided, the entire ion table will be searched to find the
ion whose \(\lambda_0\) most closely aligns with the detected centroid.
Note
Currently, when running the line finder in velocity space, only one ion definition is supported at a time. This is because there is no way to disambiguate the kinematics of multiple ions simultaneously in velocity space.
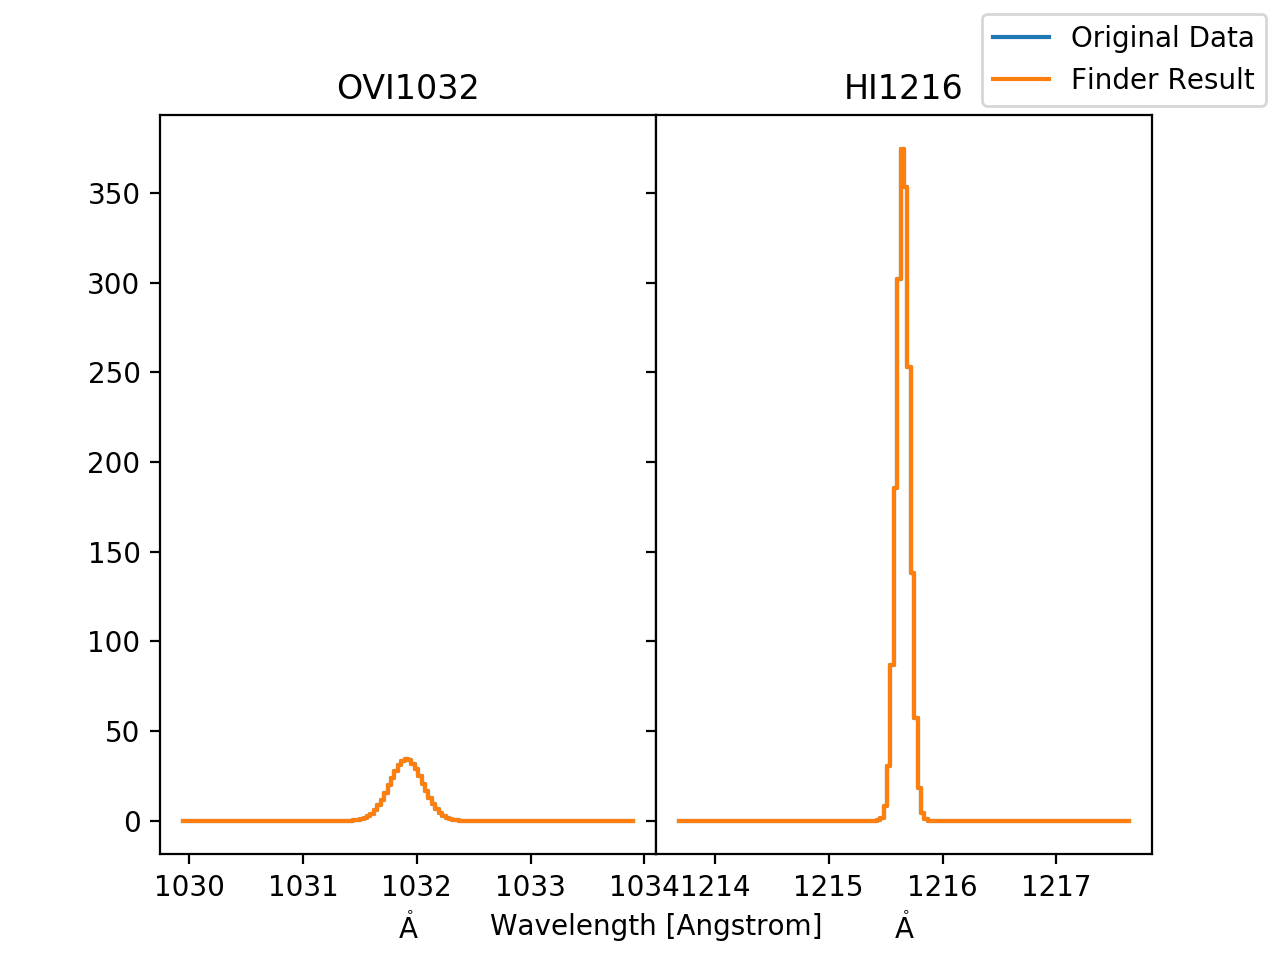
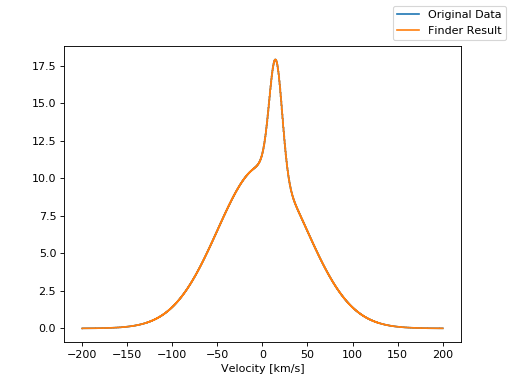
As an example of the line finder functionality, let us define two lines within a set of “fake” data.
line1 = OpticalDepth1D("HI1216", v_doppler=20 * u.km/u.s, column_density=16)
line2 = OpticalDepth1D("OVI1032", v_doppler=60 * u.km/u.s, column_density=14)

spec_mod = Spectral1D([line1, line2], continuum=1, output='optical_depth')
We will describe the lines in wavelength space to disambiguate their emission profiles without considering kinematics.
x = np.linspace(1000, 1300, 1000) * u.Unit('Angstrom')
y = spec_mod(x)
Now we tell the line finder that there are two possible lines that
any feature it comes across could be. Doing so means that any
OpticalDepth1D profiles generated
will be given the correct attributes (e.g. f_value, gamma, etc.) when
the line finder attempts to lookup the ion in the ion table.
line_finder = LineFinder1D(ions=["HI1216", "OVI1032"], continuum=0, output='optical_depth')
finder_spec_mod = line_finder(x, y)
(Source code, png, hires.png, pdf)
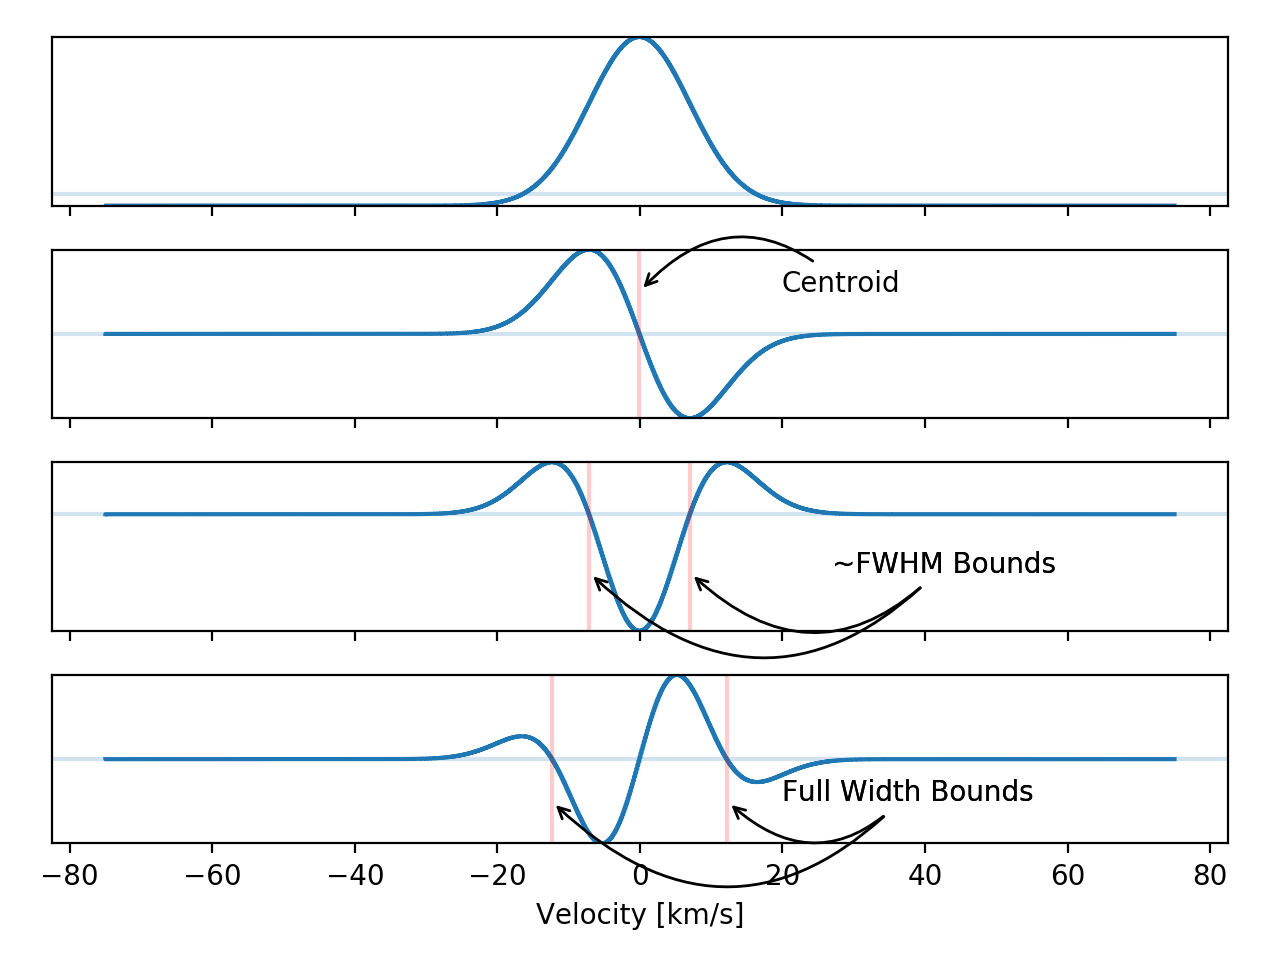
Dealing with buried lines
The line finder will implicitly deal with buried lines by considering the results of the series of convolutions and looking for characteristics that might indicate that the peak of a line is buried within the region of another profile.
The basic premise for determining the possibility of a buried line is to compare the bounds of the second differencing convolution with that of the third. A buried line is one which, in both cases, share the same found centroid, but two different sets of region bounds.
(Source code, png, hires.png, pdf)
Defining default parameters
The line finder class can accept a defaults dictionary whose values will
be applied when new OpticalDepth1D profiles
are initialized. This is an easy way, for example, to manually set global
parameter bounds information that would otherwise be up to Spectacle to determine.
defaults_dict = {
    'v_doppler': {
        'bounds': (-10, 10),
        'fixed': False
    },
    'column_density' = {
        'bounds': (13, 18)
    }
}

line_finder = LineFinder1D(ions=["HI1216"], defaults=defaults_dict, continuum=0, output='optical_depth')
Searching for ion subsets
As mentioned above, the line finder attempts to retrieve information about a potential profile by looking up the detected centroid in the ion table and selecting the nearest match. (A more extensive overview of the line registry can be found in the line registry docs). The user can provide a subset of ions that will help to narrow the possible options available to the line finder by passing in a list of ion names or \(\lambda_0\) values. The default ion list is provided by Morton (2003).
Subsets behave by limiting the entire table of ions in the registry to some specified list:
1 2 3 4 5 6 7 8 9 10 11 12 13 14 15 16 17 18 19 20 21 22 23 24 25 26 27 28 29 30 31 32 33 34 35 36 | >>> from spectacle.registries.lines import line_registry
>>> print(line_registry)
<LineRegistry length=329>
name wave osc_str gamma
Angstrom
str9 float64 float64 float64
-------- --------- --------- ------------
HI1216 1215.6701 0.4164 626500000.0
HI1026 1025.7223 0.07912 189700000.0
HI973 972.5368 0.029 81270000.0
HI950 949.7431 0.01394 42040000.0
HI938 937.8035 0.007799 24500000.0
HI931 930.7483 0.004814 12360000.0
HI926 926.2257 0.003183 8255000.0
... ... ... ...
NiII1317 1317.217 0.07786 420500000.0
CuII1368 1367.9509 0.179 623000000.0
CuII1359 1358.773 0.3803 720000000.0
ZnII2063 2062.664 0.256 386000000.0
ZnII2026 2026.136 0.489 407000000.0
GeII1602 1602.4863 0.1436 990600000.0
GaII1414 1414.402 1.8 1970000000.0
>>> subset = line_registry.subset(["HI1216", "NiII1468", "ZnII2026", "CoII1425"])
>>> print(subset)
<LineRegistry length=4>
name wave osc_str gamma
Angstrom
str9 float64 float64 float64
-------- --------- ------- -----------
CoII1425 1424.7866 0.0109 35800000.0
HI1216 1215.6701 0.4164 626500000.0
NiII1468 1467.756 0.0099 23000000.0
ZnII2026 2026.136 0.489 407000000.0
|
Passing in a list to the spectacle.fitting.LineFinder1D
will internally do this for the user
line_finder = LineFinder1D(ions=["HI1216", "NiII1468", "ZnII2026", "CoII1425"], continuum=0, output='optical_depth')
Warning
Only a single ion can be defined for the line finder if the user provides the dispersion in velocity space. This is because the line finder cannot disambiguate ions based on their kinematics.