Spectacle
Spectacle is an automated model generator for producing models that represent spectral data. It features the ability to reduce spectral data to its absorption components, fit features and continua, as well as allow for statistical analysis of spectral regions.
This package can also be used to generate analytical spectra from detailed characteristics, find potential line features, and simultaneously fit sets of absorption/emission lines.
Quick example
Include some setup imports for plotting and unit support.
>>> from astropy import units as u
>>> import numpy as np
>>> from matplotlib import pyplot as plt
>>> from astropy.visualization import quantity_support
>>> quantity_support()  # for getting units on the axes below  # doctest: +IGNORE_OUTPUT
Import the spectral model and profile model.
>>> from spectacle.modeling import Spectral1D, OpticalDepth1D
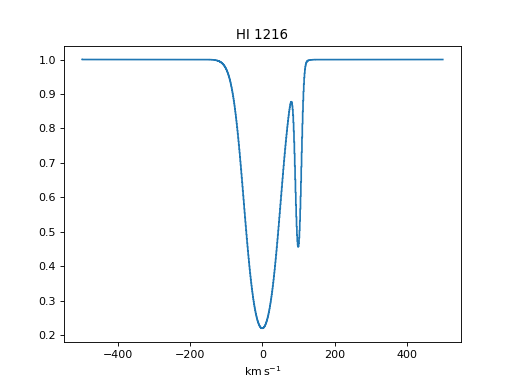
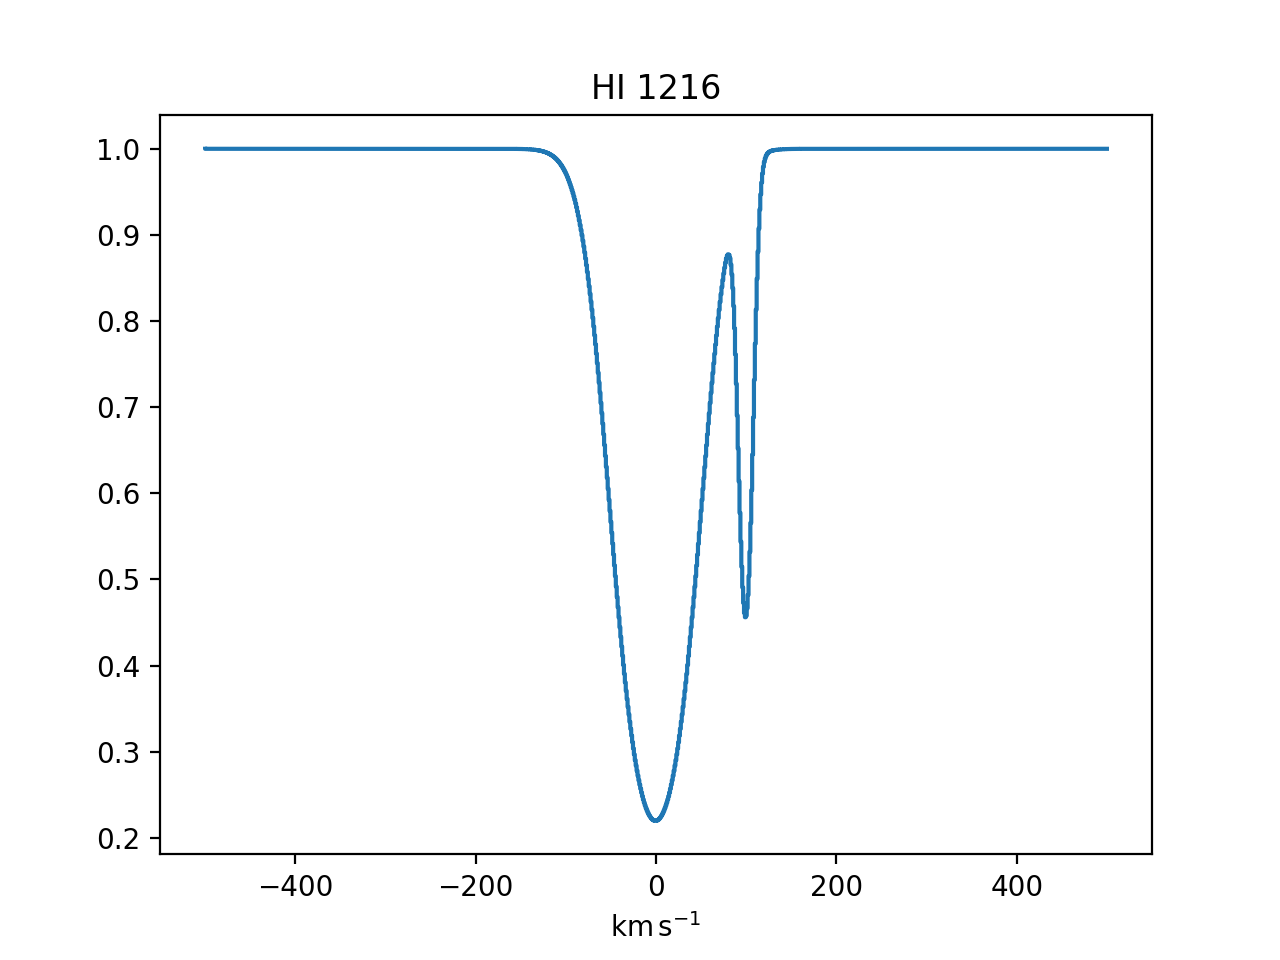
Create some HI lines to add to the spectral model. Note that all column densities are given in \(\log 1 / \textrm{cm}^2\).
>>> line = OpticalDepth1D("HI1216", v_doppler=50 * u.km/u.s, column_density=14)
>>> line2 = OpticalDepth1D("HI1216", delta_v=100 * u.km/u.s)
Create the multi-component spectral model, defining a rest wavelength and explicitly defining some redshift value.
>>> spec_mod = Spectral1D([line, line2], continuum=1, z=0, output='flux')
Generate spectral data from the model.
>>> x = np.linspace(-500, 500, 1000) * u.Unit('km/s')
>>> y = spec_mod(x)
Plot the result.
>>> f, ax = plt.subplots()  # doctest: +IGNORE_OUTPUT
>>> ax.set_title("HI 1216")  # doctest: +IGNORE_OUTPUT
>>> ax.step(x, y)  # doctest: +IGNORE_OUTPUT
(Source code, png, hires.png, pdf)
